| MC598641 | New Viva Connections Analytics Experience Coming Soon |
|---|
| Classification | stayInformed |
|---|---|
| Last Updated | 06/20/2023 23:32:16 |
| Start Time | 06/20/2023 23:32:08 |
| End Time | 08/13/2023 07:00:00 |
| Message Content |
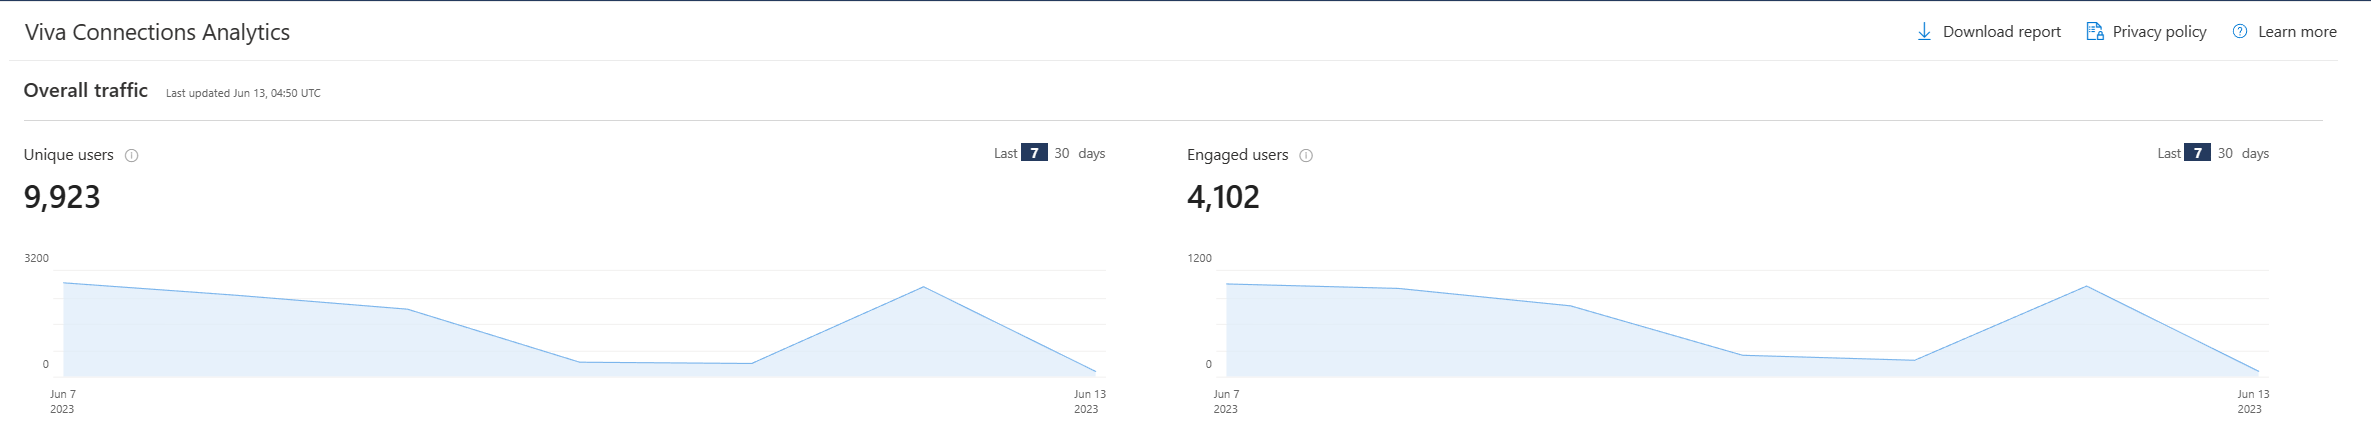
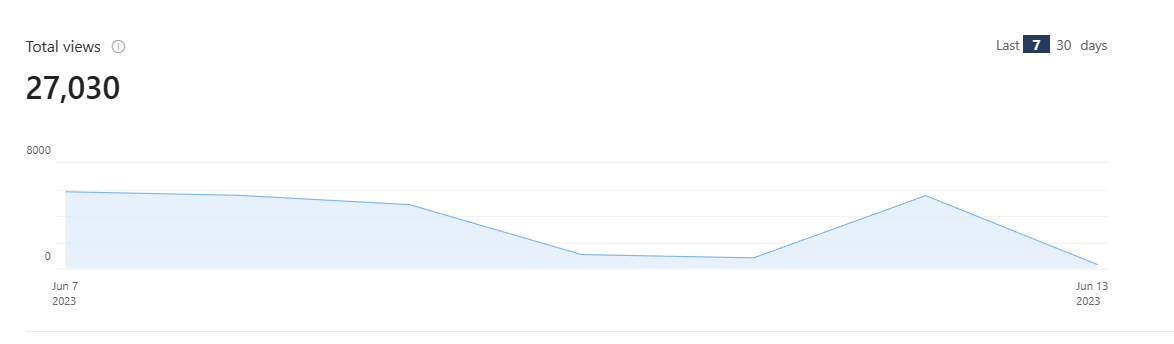
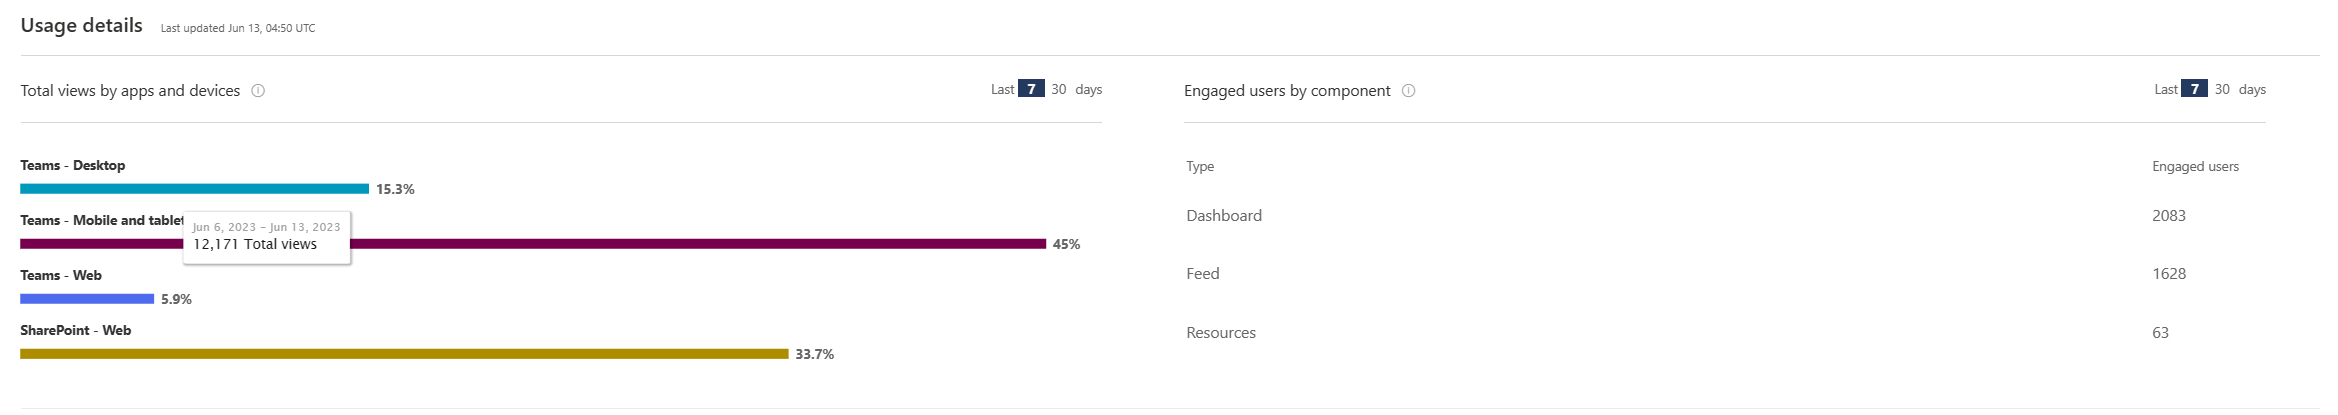
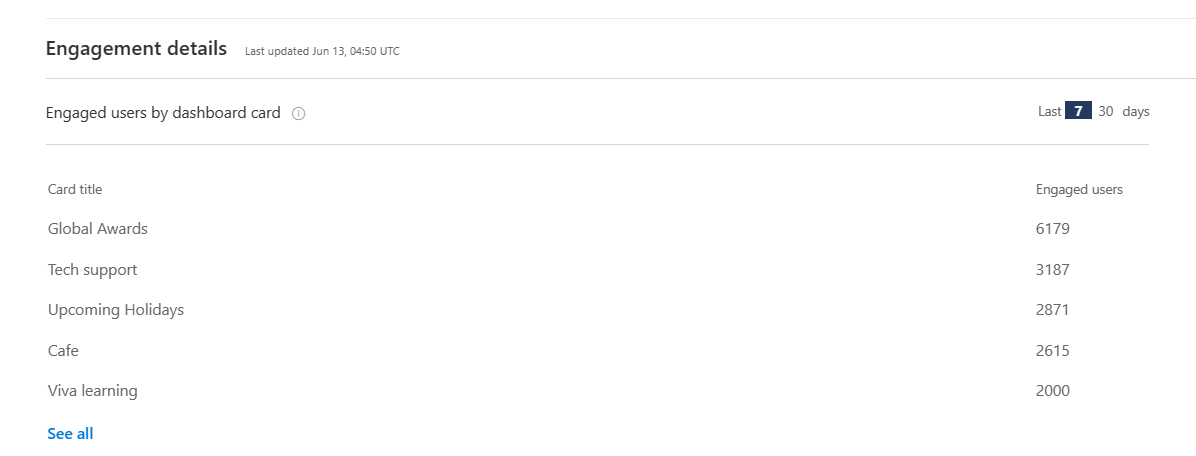
We are pleased to announce the next set of features for Viva Connections usage analytics. The analytics experience now includes a full page dashboard view that will help organizations better understand user engagement by being able to visualize the metrics. The analytics dashboard will be available through both the Viva Connections desktop experience in Teams and through a SharePoint home site if your organization has one. Additionally, this release also includes engagement metrics for individual dashboard cards which will enable a more in-depth view of popular cards and those with less engagement. This message is associated with Microsoft 365 Roadmap ID 124918 [When this will happen:] Rollout will begin in late June and is expected to be complete by mid-July. [How this will affect your organization:] The analytics dashboard will be available through both the Viva Connections desktop experience in Teams and through a SharePoint home site if your organization has one.
[What you need to do to prepare:] The features will be available by default and no additional steps are required. For additional information, please visit this documentation. |
| Machine Translation |
Viva コネクションの使用状況分析の次の機能セットを発表できることを嬉しく思います。分析エクスペリエンスには、メトリックを視覚化できるようにすることで、組織がユーザー エンゲージメントをよりよく理解するのに役立つフルページのダッシュボード ビューが含まれるようになりました。分析ダッシュボードは、Teams のViva コネクション デスクトップ エクスペリエンスと、組織に SharePoint ホーム サイトがある場合はそれの両方で利用できます。さらに、このリリースには、人気のあるカードとエンゲージメントの低いカードをより詳細に表示できる個々のダッシュボードカードのエンゲージメントメトリックも含まれています。 このメッセージは、Microsoft 365 ロードマップ ID に関連付けられています124918 [これが起こるとき:] ロールアウトは6月下旬に開始され、7月中旬までに完了する予定です。 [これが組織に与える影響:] 分析ダッシュボードは、Teams のViva コネクション デスクトップ エクスペリエンスと、組織に SharePoint ホーム サイトがある場合はそれの両方で利用できます。
[準備するために必要なこと:] この機能はデフォルトで使用可能であり、追加の手順は必要ありません。詳細については、 このドキュメントを参照してください。 |